· Abderrahmane Smimite · Engineering · 11 min read
The bug that only lives between 64 and 128 KB
Our frontend crashed only when a response was just big enough, and stress-testing it with far more data made the bug disappear. The story of an uncatchable undici assertion, a 64 to 128 KB window, and the one-line gunicorn detail that hid it from our laptops.
Some bugs crash when you add too much data. This one crashed only when we added just enough, and our attempts to stress it with far more data made it go away. It took us a long evening, one corrupted local database and a lot of wrong theories to understand why. By the time the reproduction finally crashed on cue, the date had rolled over.
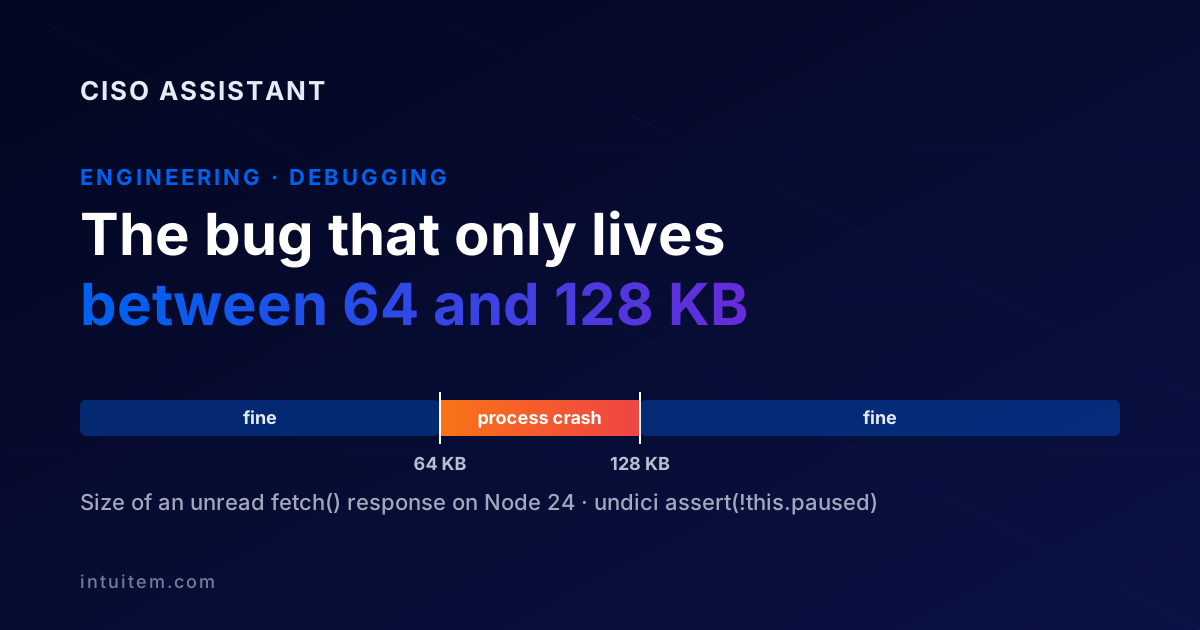
This is the story of that bug, and why its trigger sits in a window between 64 and 128 KB.
“The frontend keeps dying”
It started with a message every self-hosted product dreads: a customer’s CISO Assistant frontend kept going down. Opening one particular risk scenario was enough. The container restarted, the page went blank, and everyone else on the instance got errors until it came back up.
Around the same time, a community member opened GitHub #4903 with the same symptom and did something we’re very grateful for: they correlated the frontend and backend logs to the millisecond. Their frontend died 4 ms after sending a request, and a few milliseconds after the backend had finished answering the previous one with a perfectly healthy 200 OK. The only clue in the log was this:
AssertionError [ERR_ASSERTION]: The expression evaluated to a falsy value:

  assert(!this.paused)

    at Parser.finish (node:internal/deps/undici/undici:7388:9)
    at Socket.onHttpSocketEnd (node:internal/deps/undici/undici:7827:34)
    at Socket.emit (node:events:526:24)
    at endReadableNT (node:internal/streams/readable:1764:12)

Node.js v24.21.0
There isn’t a single line of our code in that stack. The assertion fires deep inside undici, the HTTP client that powers Node’s built-in fetch, from a socket event handler. No try/catch anywhere in the application can reach it. When it throws, the Node process simply exits.
Chasing the wrong suspects
In hindsight, the answer was in that log from the start. But when a production instance keeps falling over, you don’t start with undici internals. You start with the usual suspects, and we had plenty.
The database looked guilty. The customer kindly sent us an anonymized profile of their instance: row counts and fan-out statistics for every relation, with no actual content. Two things jumped out. The instance ran on SQLite, which allows only one writer at a time. And some risk scenarios had 65 to 102 assets attached, far more than we usually see. “Too much data somewhere” felt like a reasonable bet.
Then we found a real bug, just not this one. Those crowded scenarios came from the EBIOS RM workshop 5 sync, which copies assets from an EBIOS study into risk scenarios. We rebuilt the customer’s data shape on a scratch database and measured the sync. It ran two queries per duplicate row, and one of them reloaded the entire asset graph every time. At five times the customer’s size, it took over two minutes, well past gunicorn’s 100-second timeout. We filed it and moved on, a little sheepishly: a slow backend gives you one failed request, not a frontend process that dies.
So we threw more data at it. A thousand assets on one scenario. Then five thousand. Then a three-level asset hierarchy, with shared “hub” assets that had 59 parents each, just like the customer’s. We opened the page, braced ourselves, and nothing happened. Every page loaded fine. We didn’t know it yet, but each test we added was moving us further away from the bug.
Finally, we suspected the build. Maybe production mode behaved differently from dev? We built the production bundle and ran it locally, on the exact Node version from the report: v24.21.0, with the same undici inside. Still nothing. And somewhere in the middle of all this, our local SQLite file decided it was a good moment to corrupt itself. Not our finest evening.
Going back to the clue
After a few hours of this, we did what we should have done first: we took the assertion seriously. The reporter had already found a matching upstream issue, nodejs/undici#5360, and its title said it all: “Uncatchable AssertionError: assert(!this.paused) on socket end”. The trigger it describes is almost boringly simple. You fetch() something, and you never read the response body.
So we went looking for responses nobody reads. We didn’t have to look far. Here is what the risk-scenario page’s server loader did on every visit:
await Promise.all(
  ['assets', 'threats', 'vulnerabilities', 'security-exceptions'].map(async (key) => {
    const response = await fetch(`${BASE_API_URL}/${key}/?risk_scenarios=${params.id}`);
    if (response.ok) {
      tables[key] = { head: headData(key), body: [], meta: [] };
    }
  })
);
It asks the backend for four full lists, checks that each request succeeded, then throws the answers away. The tables are built with body: [], and the table component fetches its own rows in the browser anyway. It’s a harmless-looking leftover, the kind of code that survives a dozen refactors because nothing seems wrong with it.
Here is what happens inside undici when you do that:
- The response body arrives and nobody reads it, so undici buffers it in a stream. Once that buffer reaches 64 KiB, the HTTP parser pauses to apply backpressure.
- The backend sends its last byte and closes the connection with a FIN.
- undici’s socket
endhandler callsparser.finish(), which asserts the parser isn’t paused. It is. The assertion throws from an event handler, nothing can catch it, and the process exits.
The list of assets on the scenario that kept crashing was exactly the kind of response that would sit unread.
Too big to crash
Confident we had it, we wrote a ten-line Node script: a tiny HTTP server sends a 1 MB body and closes the connection, and the client fetches it and never reads it. We ran it, waiting for the crash.
It survived.
That was the moment the whole evening started to make sense. The upstream report used a body of exactly 64 KiB, and not by accident: it’s the smallest size that fills undici’s buffer and still arrives in a single socket read, together with the FIN. So we swept sizes, five runs each, on Node 24.21.0:
| Unread body size | Crashed |
|---|---|
| 16, 32, 60, 63 KB | 0/5 each |
| 64, 65, 70, 80, 100 KB | 5/5 each |
| 128, 200, 500, 1,024, 3,500 KB | 0/5 each |
Below 64 KiB, the body fits in the buffer, the parser never pauses, and the unread response is just a bit of garbage for the collector. Above the window, the parser pauses part-way through the transfer. Reading from the socket stops, so the rest of the data and the FIN wait in the kernel, and undici never sees the FIN while it’s paused. The crash needs the pause and the FIN to land in the same read. We measured the upper edge over loopback; upstream notes it gets intermittent over a real network.
In our data, each asset added about 600 bytes to that assets list, so the window opens at around 110 assets per scenario. Real assets carry more fields, such as owners, labels and regulatory attributes, so they get there sooner. The customer’s busiest scenarios had 65 to 102. Our heroic stress tests, meanwhile, produced 600 KB and 3 MB responses: comfortably too big to ever crash.
Why it never crashed on our machines
The size explained half of it. The other half was a question we hadn’t thought to ask: who closes the connection?
| Backend server | After each response | An unread 80 KB body | |
|---|---|---|---|
| Our dev setup | Django runserver | keeps the connection open | sits there, paused, forever |
| Production | gunicorn, default sync worker | closes it (Connection: close) | FIN on a paused parser: crash |
Our production start script passes --keep-alive 30 to gunicorn, which looks reassuring. But the default sync worker doesn’t support keep-alive and quietly ignores it, so every response ends with the connection closing. In dev, runserver keeps connections open. No FIN ever arrives, and the unread response just leaks quietly in the background. We could have stared at our laptops for another week without seeing a crash.
With both halves in hand, the reproduction took minutes. We started gunicorn with the production flags against a local database, pointed the production frontend build at it, and trimmed our test scenario from 5,000 assets down to 135, about 80 KB of JSON. We opened the page.
The process died instantly, with the customer’s exact stack trace. It’s a strange kind of relief to finally watch your own software crash.
A code-review bot later pointed out a sneakier cousin of the bug, and we tested that too. If you fetch several responses in parallel and read them one after another, the later ones sit unread while you deal with the first. After a small first body, reading a second 70 KB one never crashed. After a 3 MB first body, it crashed 10 times out of 10. An await on another request between a fetch and its read has the same effect.
Fixing it for good
The obvious fix was one line: read the body, or don’t make the request. But once we’d seen the pattern, we found it in more places than we liked. So the fix in PR #4911 comes in three layers.
First, delete the requests nobody needed. The risk-scenario page, its edit page and the requirement-assessment page were making 11 lookup requests between them whose answers went straight in the bin. They’re gone. The pages are safer and faster, and the backend has less to do.
Second, let go of bodies on purpose. A small discardBody() helper cancels a response’s stream, so undici releases it instead of pausing on it. It now runs on error paths, and in the loaders that throw on the first failed response while others are still in flight.
Third, a safety net, because we don’t trust ourselves. Even after an audit, a review bot found call sites we’d missed. Hunting down every one is a game you eventually lose. Every server-side request to our backend passes through SvelteKit’s handleFetch hook, so that’s where the net went. It reads each JSON response in full straight away and hands the loader an in-memory copy. No loader can leave one paused on a connection, however it’s written, including the ones nobody has written yet:
export async function bufferJsonResponse(res: Response): Promise<Response> {
  if (!res.body || NULL_BODY_STATUSES.has(res.status)) return res;
  const mediaType = res.headers.get('content-type')?.split(';')[0].trim().toLowerCase();
  if (mediaType !== 'application/json') return res;
  const body = await res.arrayBuffer();
  return new Response(body, { status: res.status, statusText: res.statusText, headers: res.headers });
}
It only touches application/json, matched exactly and case-insensitively, so streamed chat replies and file downloads pass through as before. Loaders were already reading these bodies in full, so memory use barely moves. And while checking what the net would catch, we noticed the database backup was labelled application/json even though it’s a gzip file. One more small thing fixed along the way.
We also wanted proof, not just a passing test. The regression test runs Node’s real fetch against a raw TCP server that sends 64 KiB of JSON and hangs up. To be sure it guards anything, we removed the buffering and ran it again: vitest caught the uncaught assert(!this.paused), blamed our test by name, and failed the run. Put the buffering back, and it passes.
What we’re taking away
Sweep sizes, don’t just push them up. Our instinct, when a bug smells like “too much data”, was to add more data. Five thousand assets felt thorough. It was the wrong experiment: the bug lived in a narrow window just above 64 KB, and every test we ran jumped straight over it. When size matters, test the sizes in between.
The production build isn’t the production setup. Same Node version, same build, still no crash. The trigger was a server setting nobody thinks about: gunicorn closes every connection, and runserver never does. Reproducing a production bug means copying the whole path a request takes, not just the frontend.
An unread response isn’t free. In most runtimes it’s a small leak nobody notices. On Node 24 with its bundled undici 7, in the wrong size window, it takes down the process for everyone. If a loader only needs the status, it shouldn’t fetch the body. If it doesn’t need the request, it shouldn’t make it.
Fix the class, not just the instance. We found the first call site, then more, then a bot found a few we’d missed. One guard at the choke point covers the ones we know, the ones we missed and the ones that haven’t been written yet.
Keep the net even after upstream fixes it. The undici issue is closed, but the thread was still asking for a backport to undici 7, the version Node 24 bundles. Pinning a different Node 24 release wouldn’t help: we reproduced the crash on 24.21.0, and others in the thread hit it on 24.17 and 24.18. Until a fixed undici reaches the Node releases people actually run, the safety net stays.
A big thank you to the community member behind #4903. Their log correlation and the upstream link saved us far more time than they probably realize. And if you run a Node server that calls a backend with fetch, whether SvelteKit, Next.js or anything else, it might be worth a quick search for responses your code never reads. One of them may be a single medium-sized payload away from taking your server down.